

Know how many units customers will buy. Before volumes are fixed.
Production runs, listings and launch budgets are set long before launch. Horizon measures purchase intent for your new product against an existing product of yours and turns it into volume scenarios. A building block that puts your planning on real customer behaviour and makes it more precise.
Grinder G2. Café grind at home.
€169
Units in year 1, all channels, from the measured ratio and your sales data.
Purchase intent 1.32× your reference product
The weakest number
Every plan rests on the volume. It has the least evidence.
Price, margin and costs are known. The volume behind them usually comes from stated intent, from a similar product or from a market share someone assumed. None of these shows how your target group responds to this offer at this price. Horizon adds the input that does, so the volume in your plan rests on measured behaviour.
Where launch volumes come from today
Survey
Stated purchase intent, reduced by a blanket correction factor
Analog
Sales of a similar product, carried over to the new one
Market
An assumed share of an estimated market
Horizon
Measured purchase intent, calibrated against the real sales of your own product
From test to volume
How a test becomes volume scenarios.
The scenarios are a building block of your demand planning. Combined with your own data, they let your teams plan more precisely, on real customer behaviour, with every assumption visible.
01
Your product as the yardstick
An existing product of yours with known sales runs anonymised in the same test, under the same neutral brand, budget and audience.
02
A ratio, not a volume
The test measures purchase intent for the new product relative to yours, for example 1.32×. The same signal sits on both sides, so the step from intent to order largely cancels out.
03
Applied to real sales
The ratio starts where test and reality match: your own online shop in the test region. From there it is scaled to all online channels and the whole country, using the regional share of that same channel.
04
Adjusted once, not twice
Only what differs from your product is adjusted: order completion in a higher price band, brand and first-year ramp-up. Revenue uses the realised price, not the list price.
Range and levers
The range shows what was measured. The levers show what was assumed.
Conservative, central and optimistic come only from the measurement precision of the ratio. Every assumption is listed separately, with its plausible span and its effect on the volume, so you know which input to replace with your own data first.
In the model
Plausible span
Effect
Measured ratio to your product
1.32
1.08 to 1.61
1.5× · the range
Order completion, higher price band
0.80
0.60 to 1.00
1.7×
Ramp-up in year 1
0.45
0.35 to 0.70
2.0× in year 1
Brand effect
1.05
1.00 to 1.30
1.3×
Realised vs list price
78%
68 to 95%
1.4× on revenue
Each set value is replaced by a measurement as soon as your data is in, for example your cart-to-order rate per price band. Example values.
Typical questions
Which volume question do you face?
Wherever production, stock or budget is committed before customers have bought.
01
New category or not
Does the potential clear the threshold your board has set for a new category?
02
First production run
How many units for the first run, and does demand cover the minimum order quantity?
03
Price and volume
Which price leaves enough volume to pass break-even?
04
Launch budget
What does it cost to win an order, and how much budget does the launch need?
05
Markets and roll-out
Which countries in which order, and in which year does the cumulative contribution cover the investment?
06
Line extension
How does demand for the new variant compare with the product it will sit next to?
Methods compared
Survey, analog product or behavioural test?
All three can sit side by side in a business case. Horizon adds the input that rests on behaviour and makes the plan more precise.
Survey-based estimate
Analog product
Horizon
Basis
Stated intent, corrected by a blanket factor
Sales history of a similar product
Measured purchase intent, calibrated against your own product
Captures
What people say they would buy
What a different product sold
What your target group does when price and alternatives are in play
Limit
Stated intent overstates real demand
Says nothing about the pull of the new product
Strongest combined with your planning data
Output
One number
One number
Three scenarios from the measurement, every assumption listed with its effect
How a test works
Volume scenarios in around four weeks.
Your effort: a briefing, product details, sales data of the reference product and four short meetings.
Week 1
Question and reference
We sharpen the question, define up to six variants and choose the reference product with you.
Week 2
Ads and offer pages
Horizon builds realistic ads and offer pages under a neutral brand, the reference product included.
Week 3
7 days in field
Your target group sees the offers in their familiar online environment and decides. You follow everything live.
Week 4
Result and scenarios
Purchase intent per variant, statistically validated, and volume scenarios as a data analysis for your business case.
To take away
The market volume template.
The calculation behind the scenarios as a spreadsheet, worked through on an example case: from the test ratio to volume and revenue, with the lever register, sensitivities, several markets and a five-year ramp-up against your investment. Every cell is a formula, so you can follow each step and use your own figures.
Excel, German and English. Free, download right after a short form.
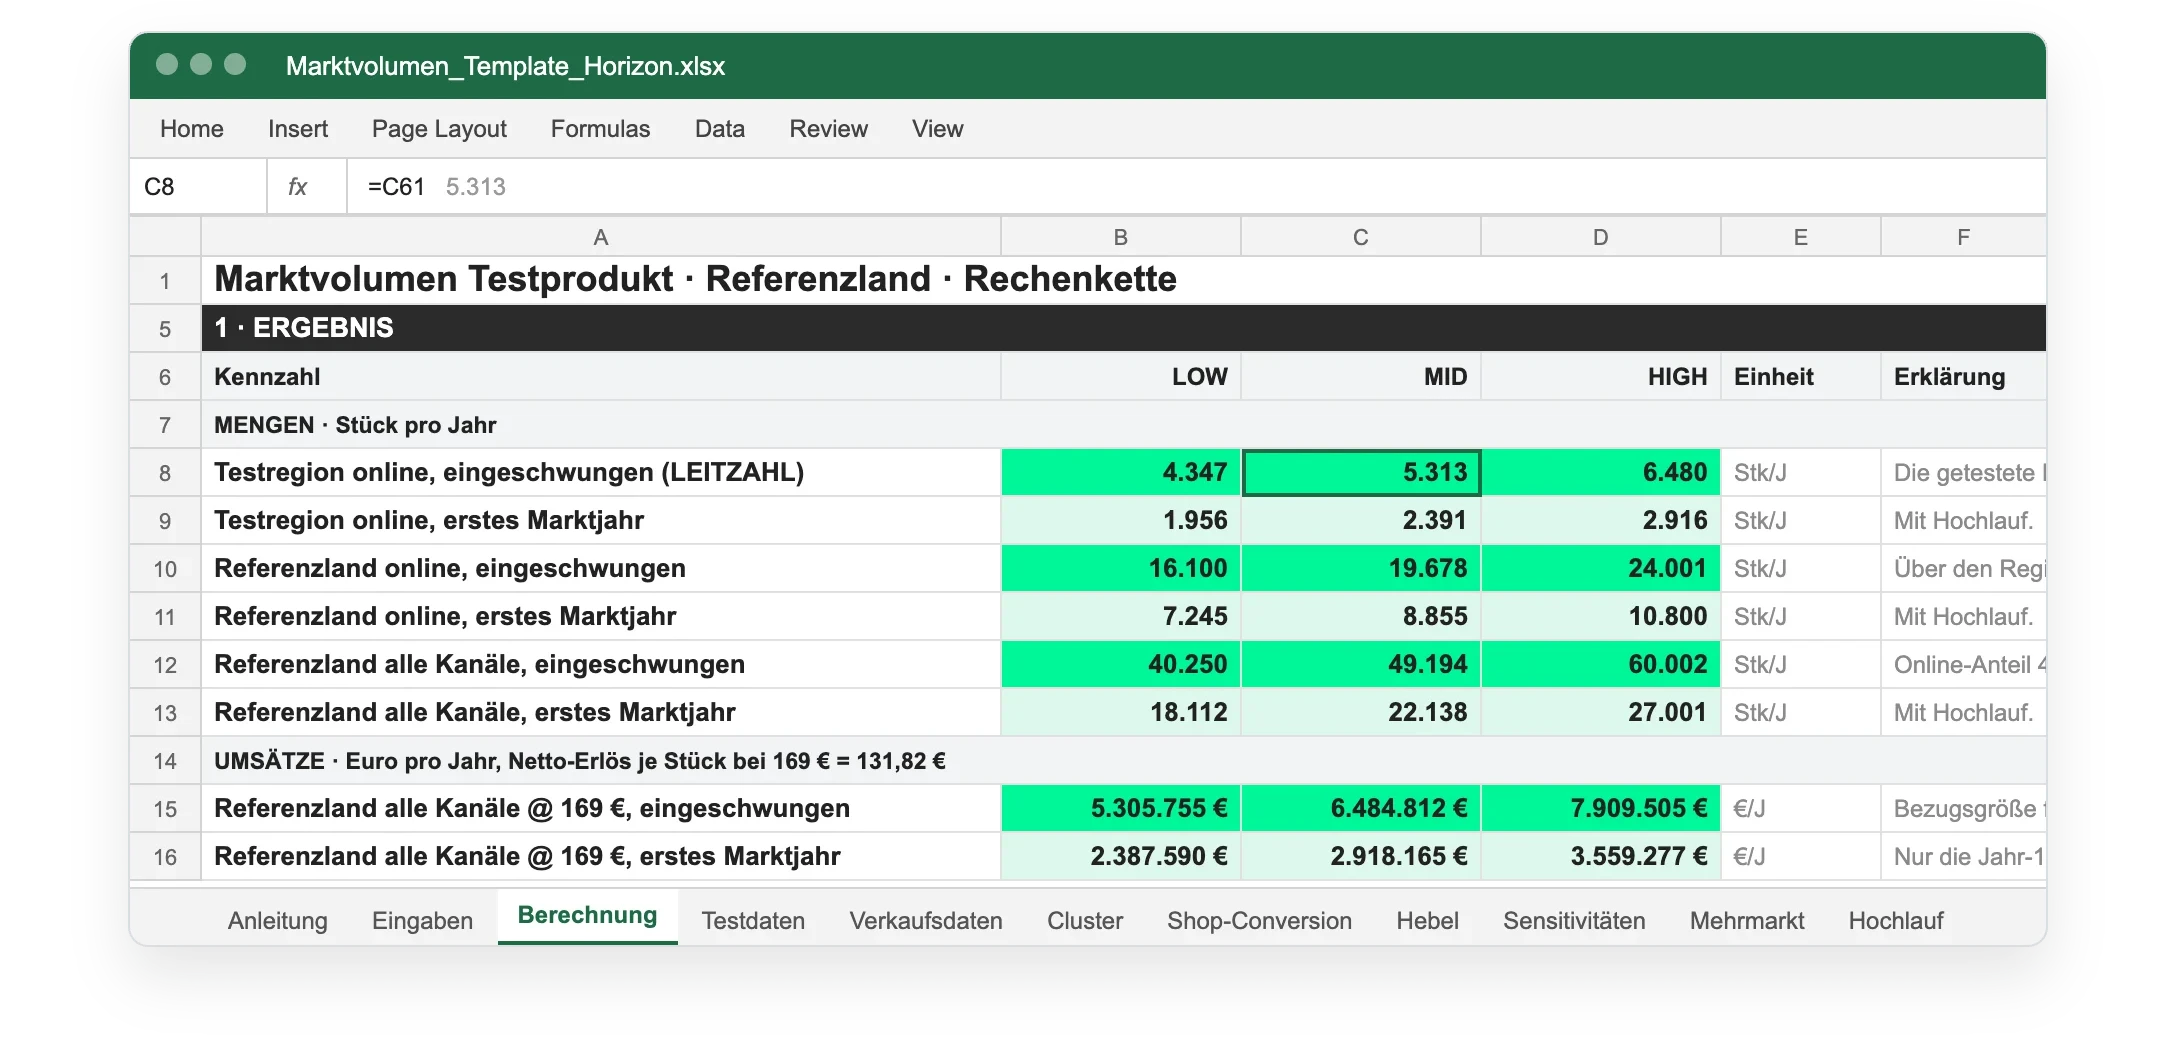
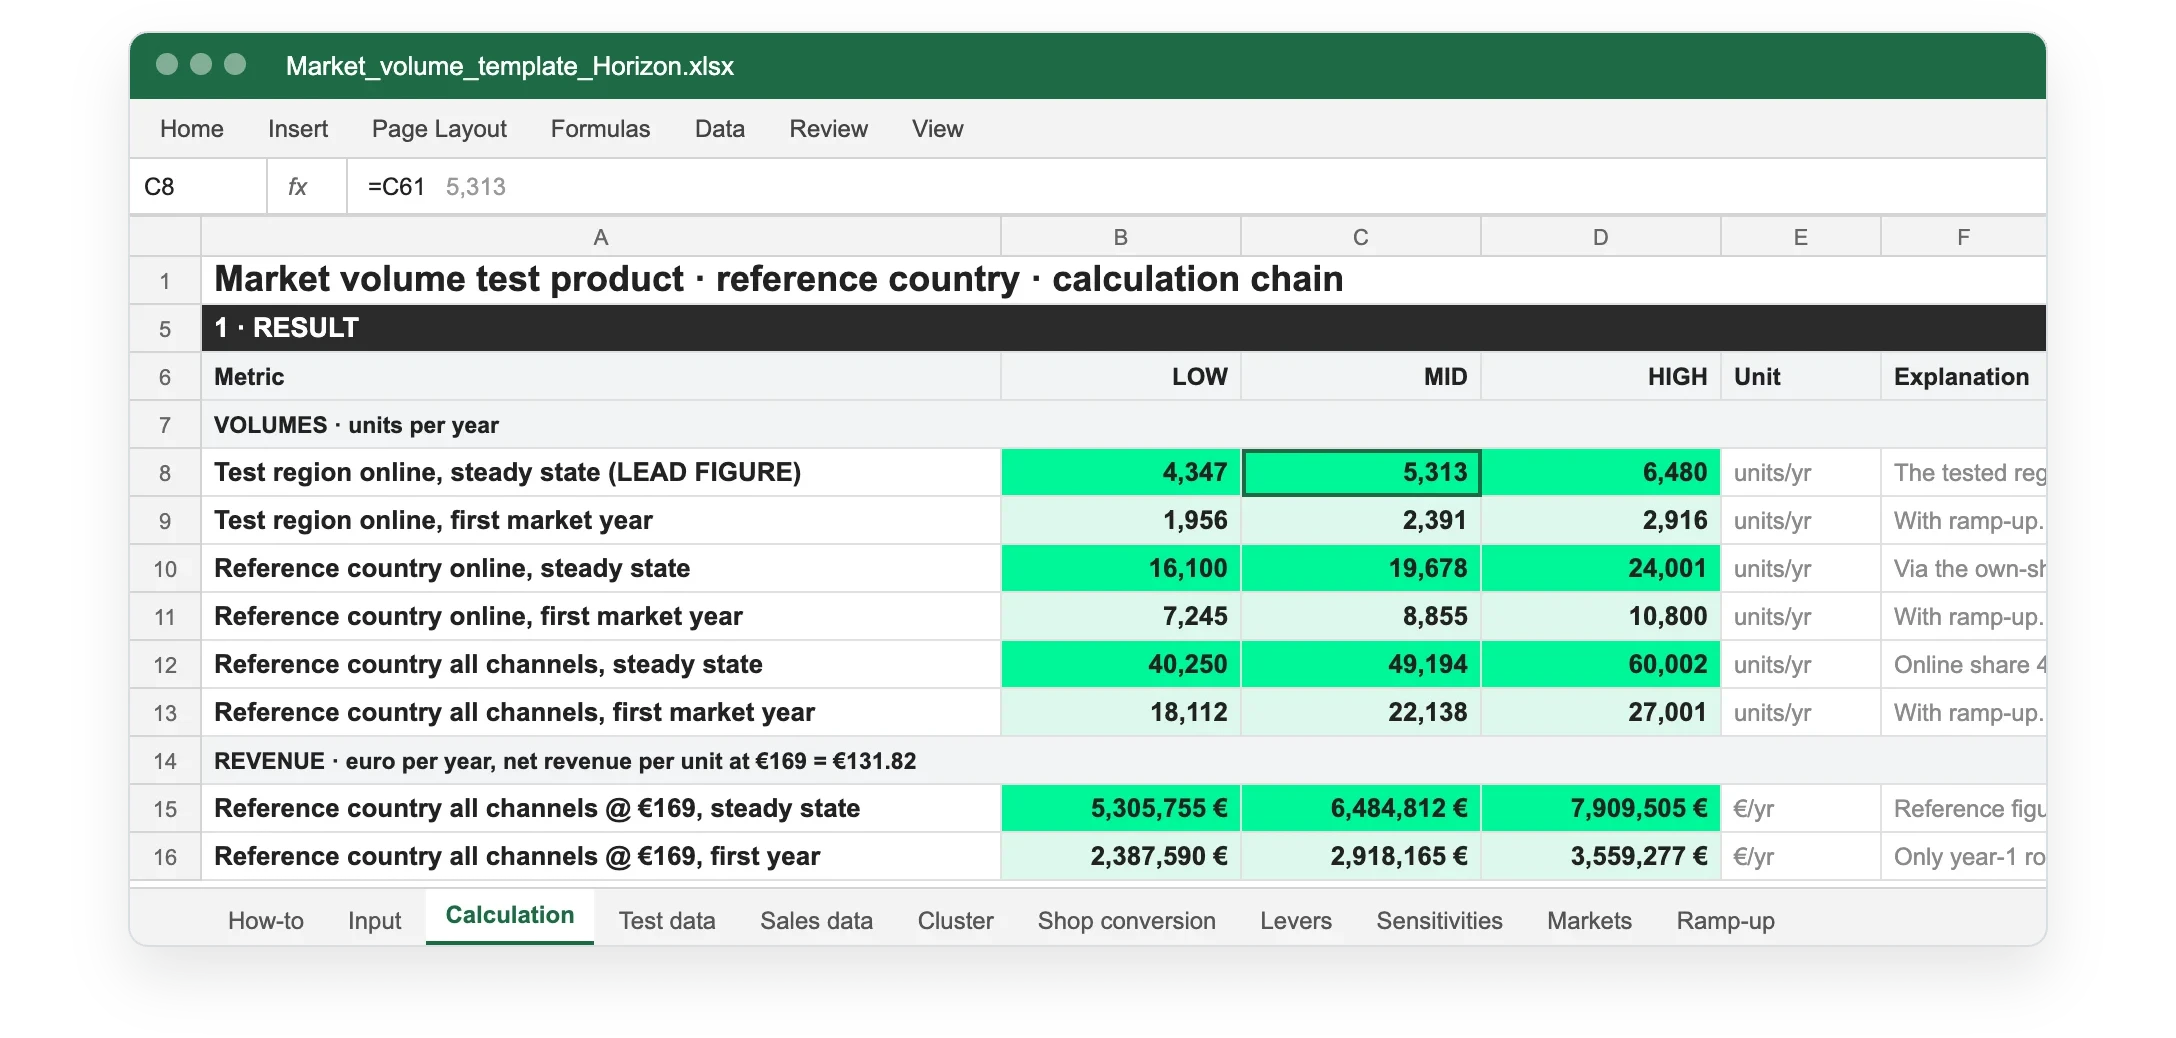
Sheet "Calculation" of the template, worked through on an example case.
FAQ
Frequently asked questions.
How does this fit into our demand planning?
As a building block. Horizon measures how your target group responds to the new product and turns it into volume scenarios. Your teams combine them with their own data and plan more precisely, on real customer behaviour instead of estimates.
The test measures purchase intent, not orders. Does that inflate the volume?
No, because the volume comes from a ratio. Purchase intent sits on both sides, for the new product and for yours, and your product's real sales already contain the step from basket to order. Only the difference between price bands is adjusted, ideally with your own cart-to-order rates.
Which data do we need to provide?
Sales of a comparable existing product by channel and, if available, your cart-to-order rate and returns. Where data is missing, the scenarios work with ranges.
Does our sales data have to leave the company?
No. Horizon can deliver the measured ratios and a calculation template, and your team adds its own figures.
What about retail and other offline channels?
The test measures behaviour online. Retail figures are usually deliveries to retailers, not purchases by end customers, so they appear as a separate line with their own distribution factor. Regional shares are taken from your own online shop, because retail channels book volumes where their warehouses are, not where customers buy.
What about seasonality?
The test period is documented. In a seasonal category, the ratio to the reference product is applied to your seasonal curve, not to a single month.
The test runs under a neutral brand. Does our brand change the volume?
It can. The brand effect is a parameter in the scenarios that you set together with marketing, so its influence on the result stays visible.
Let's talk about your next decision.
You bring the product and your planning question, we sketch a test design including the reference product. No preparation needed on your side.

You will speak with Daniel Putsche
Founder & CEO, 30 minutes
Read more