

Home/Roles/ Demand planning & controlling
Plan launch volumes more precisely, on what customers do.
For demand planning, S&OP, purchasing and controlling: a building block for your plan. Volume scenarios for new products, based on purchase intent measured before launch and calibrated against your own sales data.
Business case input
Year 1 · volume target
Price €149
Revenue year 1 €3.0m
26,000
Price €189
Revenue year 1 €2.3m
15,400
Price €169
Revenue year 1 €2.9m
22,100
Ratio to your reference product per price. At €169, year 1 ranges from 18,100 to 27,000 units. Example values.
Your core question
How many units do we plan for a product nobody has bought yet?
Where plans go wrong
You carry the risk of a volume someone else estimated.
The volume for a new product usually comes from innovation, product or market research, often from a survey or a comparable product. Planning and controlling then commit production, stock and budget to it.
Schematic illustration.
Schematische Darstellung.
Use cases
What changes for planning and controlling.
You commit production, stock and budget. Horizon puts measured customer behaviour into that plan first.
01
First production run
Size the first run and check minimum order quantities against measured demand.
02
Business case
Volume scenarios with every assumption visible, ready for the committee.
03
Price and volume
Volume and break-even per price point, side by side.
04
Launch budget
The measured cost per purchase intent as a basis for planning the cost of an order.
05
Markets and channels
Compare volumes across countries before you allocate stock.
06
Plan versus actual
After launch, compare scenario and actual sales, and calibrate the next plan.
How a test works
Volume scenarios in around four weeks.
Your effort: sales data of the reference product and a short review of the assumptions. The Horizon team takes care of the rest.
Week 1
Question and reference
The question is sharpened, up to six variants are defined and the reference product is chosen.
Week 2
Ads and offer pages
Horizon builds realistic ads and offer pages under a neutral brand, the reference product included.
Week 3
7 days in field
The target group sees the offers in their familiar online environment and decides.
Week 4
Result and scenarios
Purchase intent per variant, statistically validated, and volume scenarios for your planning.
Working together
Your colleagues test. You plan with the result.
Tests usually come from innovation, product or market research. Planning and controlling receive the result as volume scenarios they can work with directly. Your plan gets more precise without leaving your model.
Reference product chosen with you: the product your planning already knows best
Your sales data can stay with you: Horizon delivers ratios and a calculation template
Every lever on the table, with its plausible span and its effect on the volume
In the model
Plausible span
Effect
Measured ratio
1.32
1.08 to 1.61
1.5× · the range
Order completion
0.80
0.60 to 1.00
1.7×
Ramp-up year 1
0.45
0.35 to 0.70
2.0× in year 1
Brand effect
1.05
1.00 to 1.30
1.3×
Realised vs list price
78%
68 to 95%
1.4× on revenue
To take away
The market volume template.
The calculation behind the scenarios as a spreadsheet, worked through on an example case: from the test ratio to volume and revenue, with lever register, sensitivities, several markets and a five-year ramp-up. Every cell is a formula.
Excel, German and English. Free, download right after a short form.
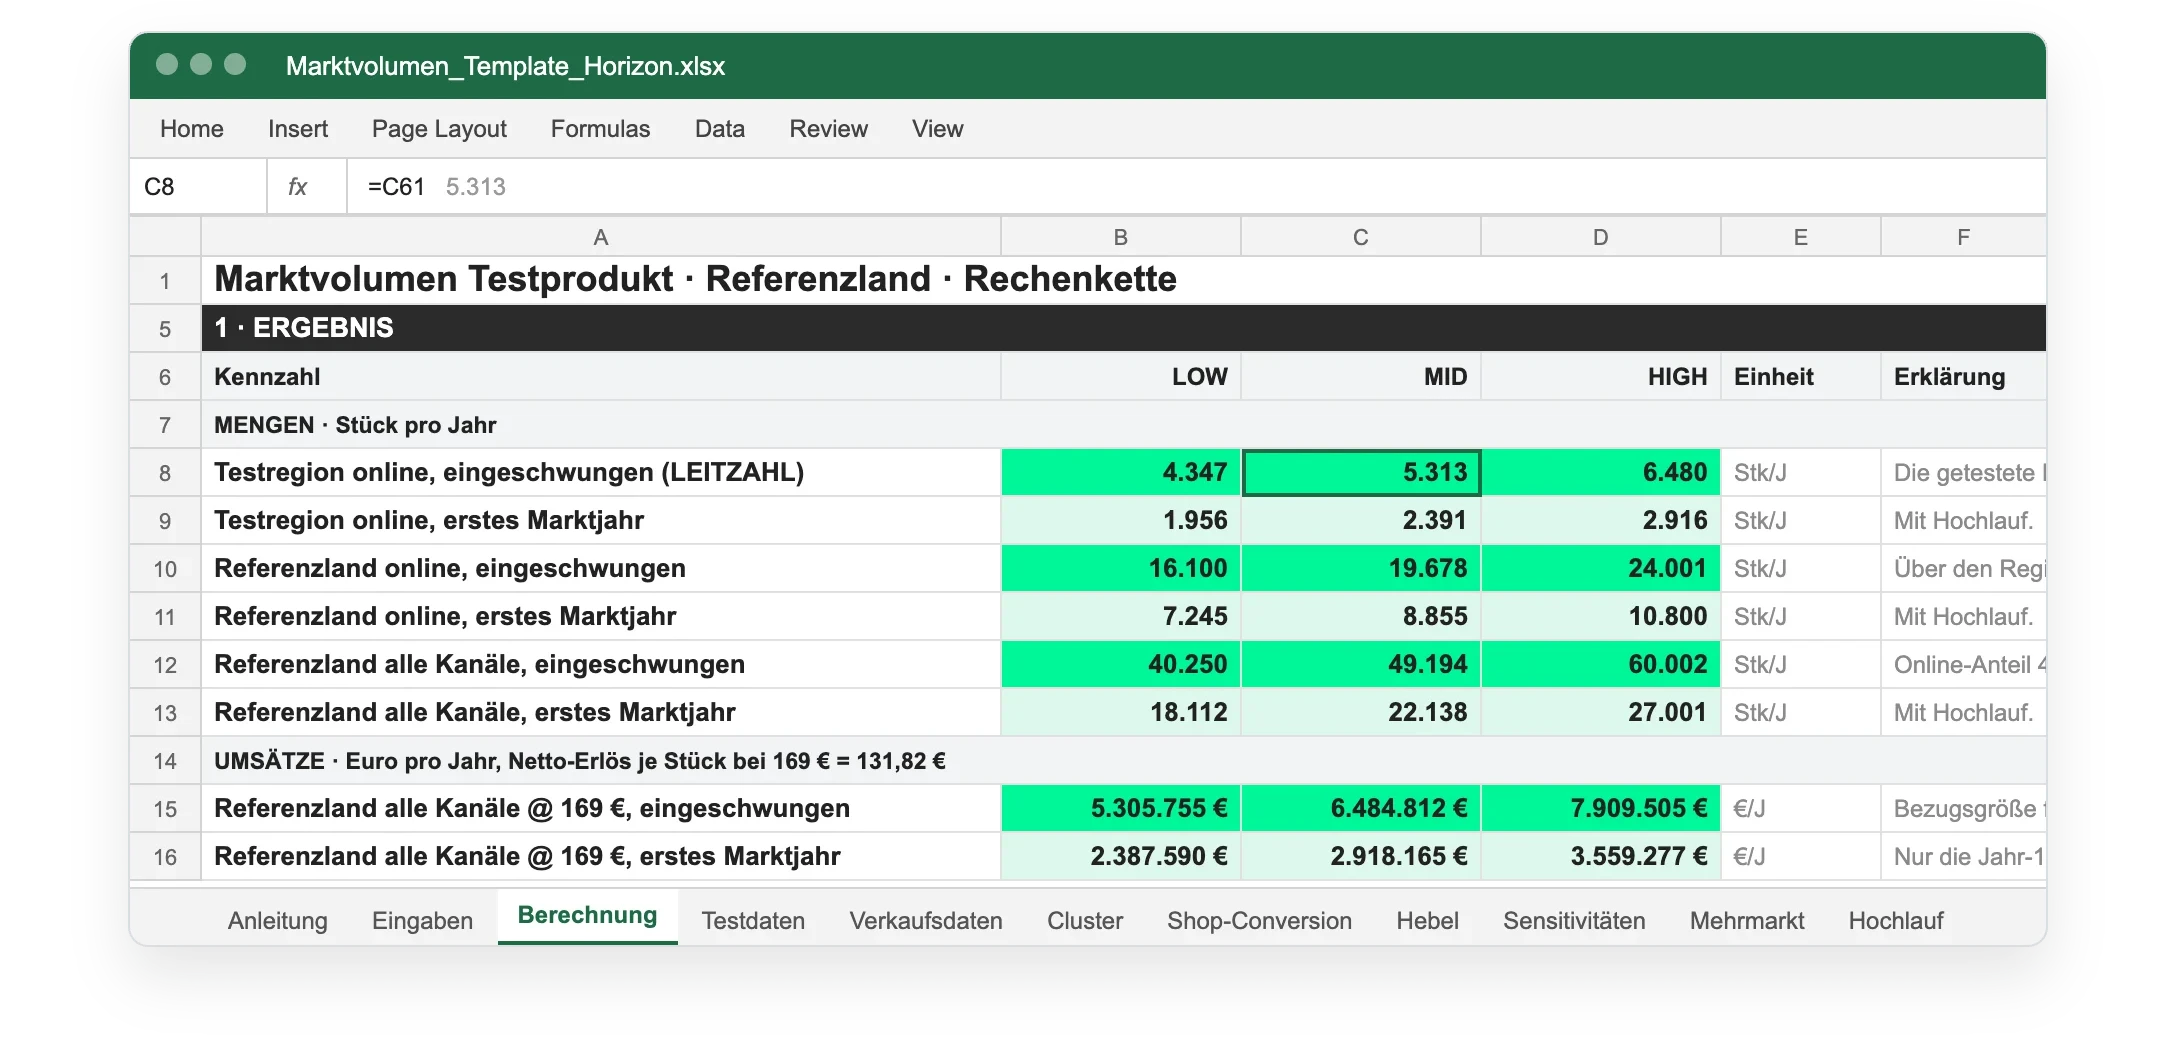
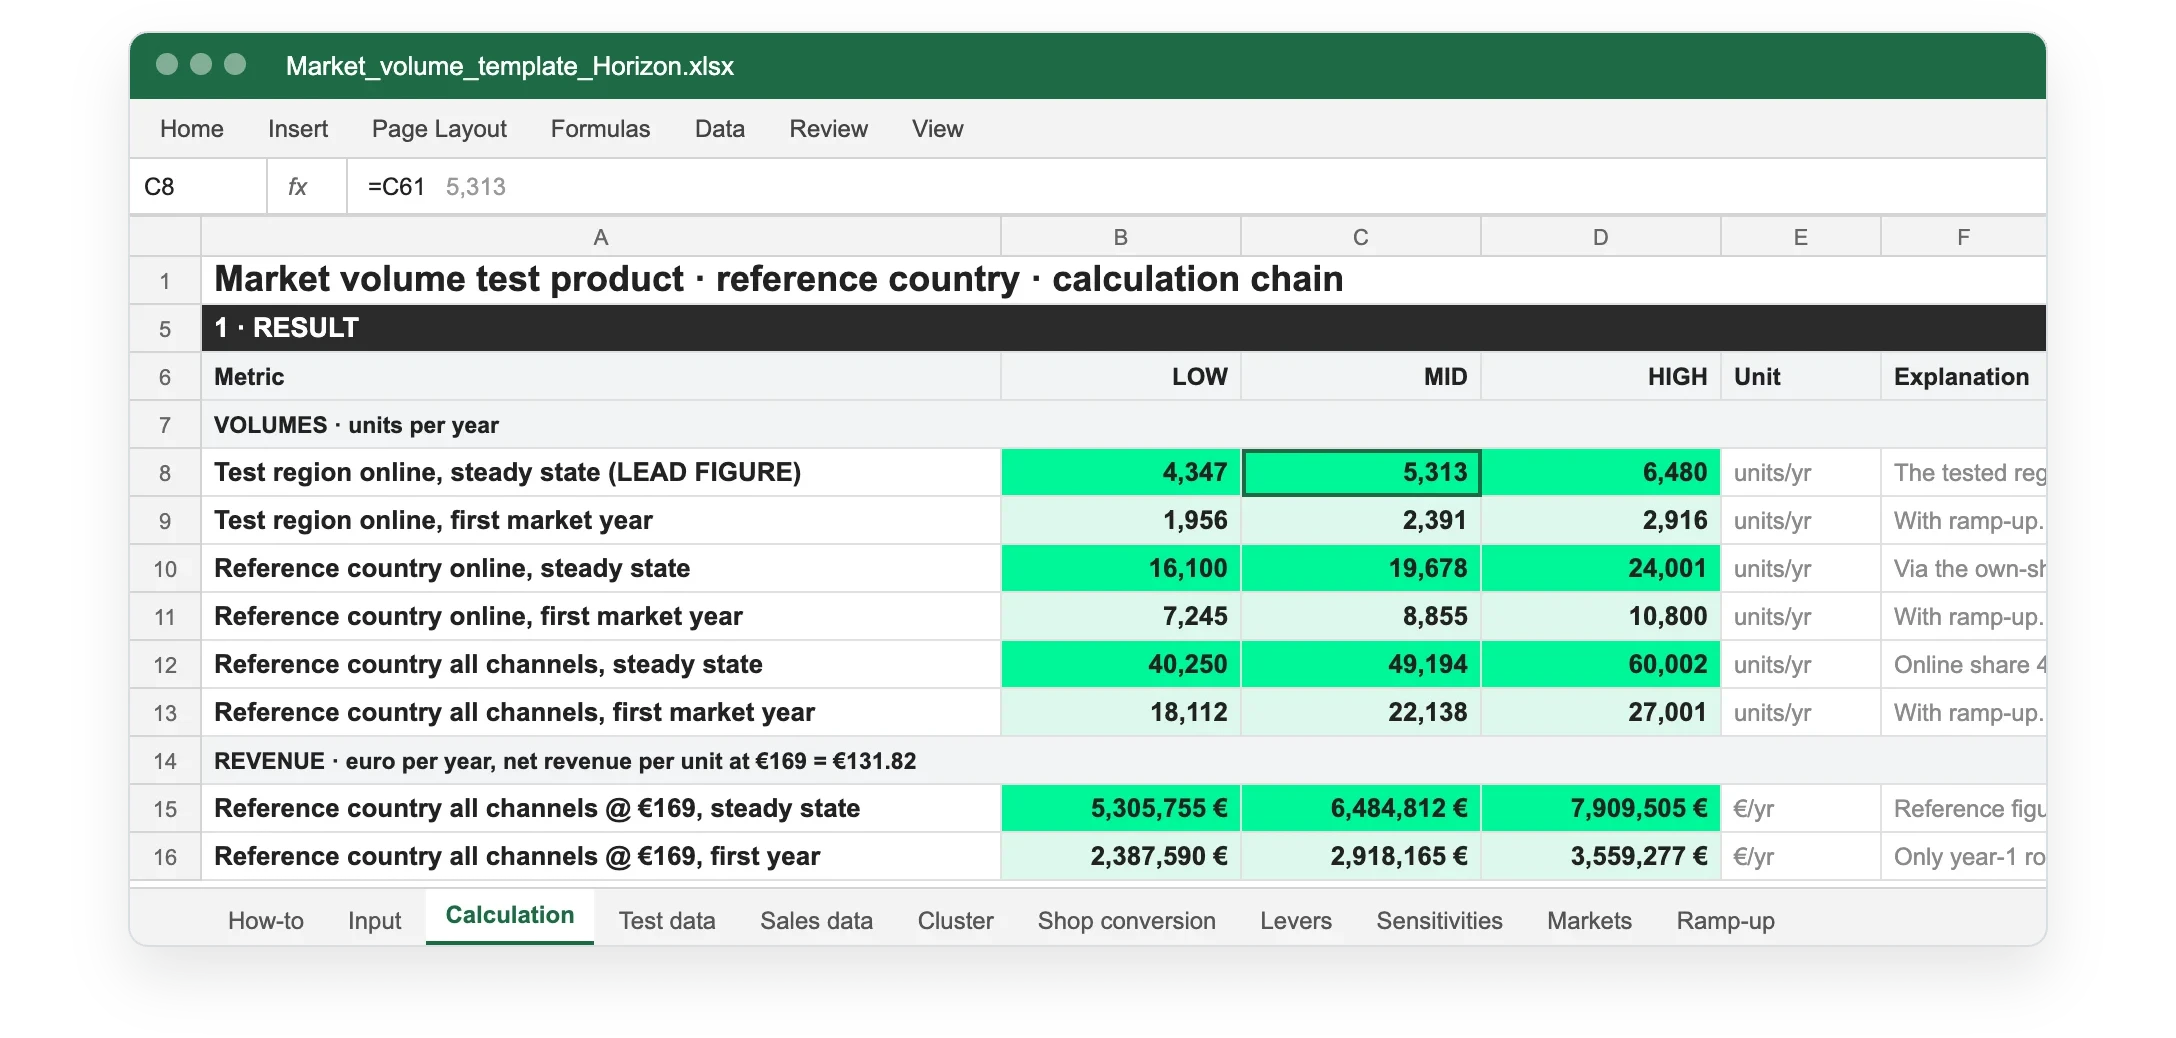
Sheet "Calculation" of the template, worked through on an example case.
FAQ
Frequently asked questions.
How does this fit into our planning system?
As an input to it. Planning systems extrapolate from history, and a new product has none. Horizon closes that gap with volume scenarios measured on real customer behaviour before launch, so your existing model starts from evidence instead of an estimate and your plan becomes more precise.
How reliable are the scenarios?
The range comes from the measurement precision of the test. Everything set rather than measured, such as ramp-up or brand effect, is listed separately with its span and effect, and can be replaced with your own data. The more of your data goes in, the more precise the plan.
Who in our company runs the test?
Usually innovation, product or market research. Planning and controlling should help choose the reference product and the data, so the result fits your model.
Which data do we need?
Sales of a comparable existing product by channel and, if available, your cart-to-order rate and returns. Where data is missing, the scenarios work with ranges.
Can we compare the scenarios with actual sales later?
Yes. Once the product is on the market, comparing scenario and actual sales shows how to calibrate the next test.
Let's talk about your next decision.
You bring the product and your planning question, we sketch a test design including the reference product. No preparation needed on your side.

You will speak with Daniel Putsche
Founder & CEO, 30 minutes
Read more