

Planning a price increase: how to know in advance whether customers will pay the new price.
One percent on price can move operating profit by around eleven percent, in both directions. Why you should test a price increase against real purchase behaviour before it goes live.

In short
- Price is the strongest profit lever: 1% more on price raises operating profit by 11.1% on average (Marn and Rosiello, HBR 1992).
- Surveys distort willingness to pay. On average, respondents state around 20% more than they actually pay.
- A price test shows before launch how much demand a higher price costs, and therefore which price earns the most.
Pricing decisions are among the most consequential decisions a company makes: a price increase for existing customers, the entry price of a new plan, the premium for a higher-end variant. Yet they often rest on gut feeling, competitor comparisons or survey answers. It is possible to measure in advance at which price customers actually buy.
Why price is the strongest lever
Michael Marn and Robert Rosiello analysed the cost structure of 2,463 companies. Their finding: a 1% improvement in price raises operating profit by 11.1% on average, all else being equal. The same improvement in variable costs, volume or fixed costs has a much smaller effect.
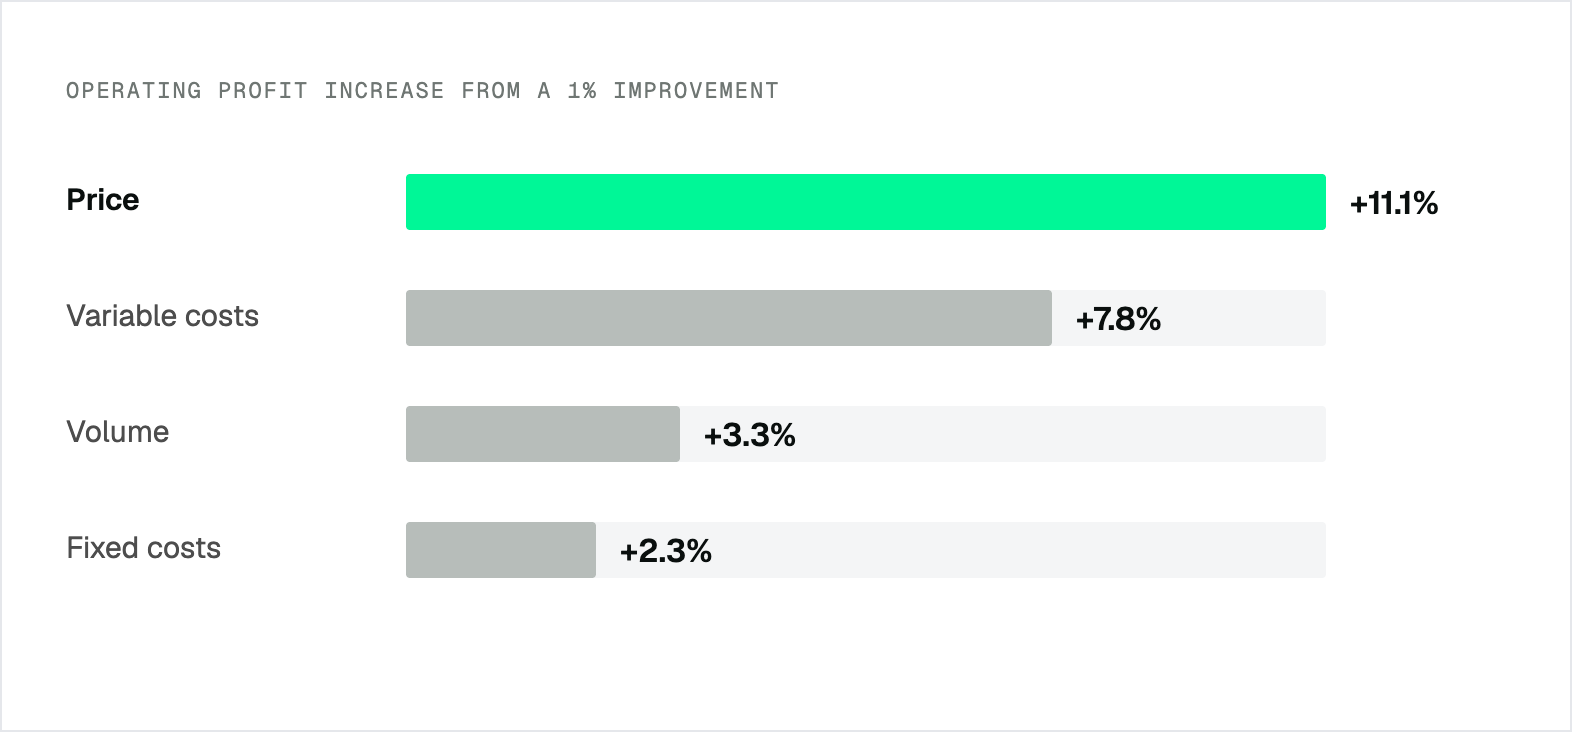
The lever also works the other way: every percent a price is too low costs a corresponding amount of profit. Every pricing decision leaves one open question: how much demand does the higher price cost?
Why surveys get price wrong
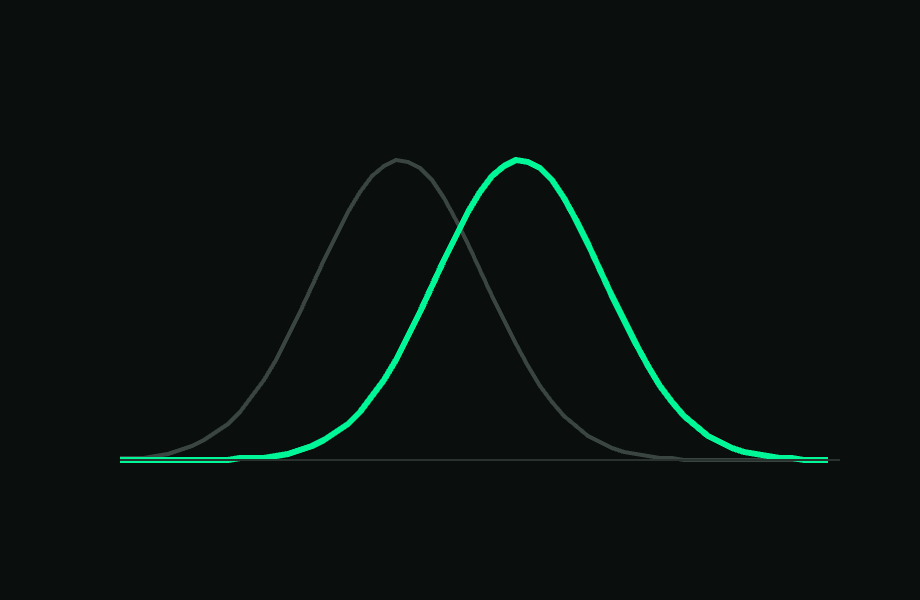
A survey lacks the purchase situation itself: the price next to the alternatives, the moment of decision and its consequence. Without them, answers are more generous. A meta-analysis of more than 100 studies shows that respondents state a willingness to pay around 20% higher than what they actually pay (Schmidt and Bijmolt, 2020). You do not know in advance in which direction your own number deviates.
Van Westendorp and conjoint remain valuable: for a first price range and for weighting many attributes. For the final decision between a few prices, a measurement of real behaviour helps.
How a price test works
Comparable groups from your target audience see the same offer in a realistic ad and on a realistic offer page, each group at a different price. What is measured is the purchase or sign-up decision. Nothing is sold and no payment is taken; anyone who decides learns straight away that the offer is not available yet.
- Up to six price points per test, all other elements stay the same.
- Separate, randomly assigned groups per price, so results are comparable.
- Around four weeks from question to result, of which about seven days in the field.
The highest purchase intent is not the best price
A low price almost always wins the most decisions. Only the combination of purchase intent and price, the revenue per price point, shows the best price, and with your costs, the margin.
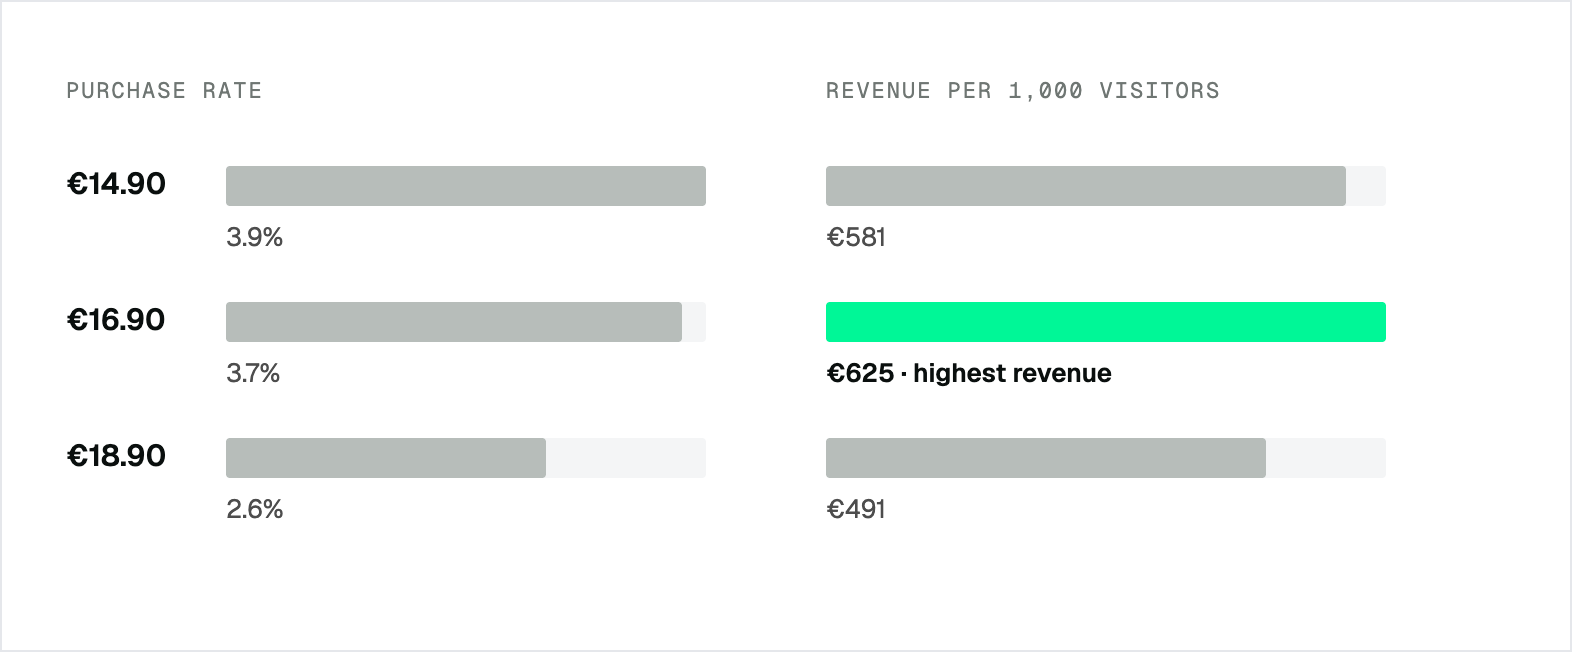
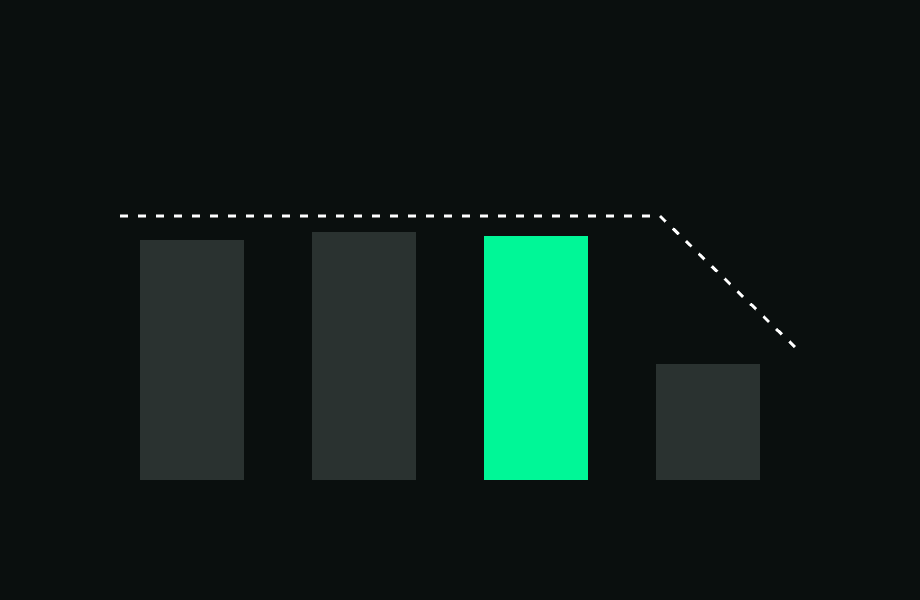
In the example, the middle price loses hardly any demand compared with the lowest, but brings around 8% more revenue. The highest price, by contrast, costs noticeable demand.
An example from practice
Virgin Pure wanted to know how far the monthly price of a water dispenser could rise before demand was lost. Four prices, four offer pages, 3,574 consumers, seven days in the field. Demand held steady up to an increase of 15%; only at the highest price did it drop. Virgin Pure raised its price by 15%. How the test was set up and what a second test on anchor pricing showed is described in the Virgin Pure case.
What a price test does not do
A price test measures purchase decisions in a realistic situation. It is not a revenue forecast for the whole market and not a guarantee. How competitors react, or how many existing customers cancel after an increase, you look at separately. As a basis for choosing between specific prices, it is far more robust than a stated willingness to pay.
Frequently asked questions
How many price points make sense?
Up to six per test. How many fit your question depends on how fine the price-demand curve needs to be.
Does this also work for price increases for existing customers?
Yes. Comparable groups from your target audience each see the offer at the current or the new price. That shows how much demand the increase costs before it goes live.
About the author
Daniel Putsche
Founder and CEO of Horizon. Works with product, pricing and insights teams to base decisions on measured purchase behaviour.
Related articles




Which decision do you want to validate?
Bring your decision question, we sketch a possible test design with you. No preparation needed on your side.

You will talk to Daniel Putsche
Founder & CEO, 30 minutes