

Testing a price increase: how to analyse two price variants statistically.
When is a difference between two prices real? A worked example from sample size to decision, with the questions you should answer before the start.

In short
- The sample size follows from the required precision: at a 4.4% decision rate, you need about 1,600 visitors per variant for ±1 percentage point.
- The analysis compares the share of decisions per variant, with a significance test and the probability that a variant is the best.
- The real question for a price increase: does the higher price cost more demand than it brings in?
A company wants to raise the price of a product by 10%. A test should first show whether that costs demand. Two variants of the same offer page, one at the current price, one at the new price. How do you analyse this properly? The numbers in the example are sample values.
Before the start: the decision and the rule
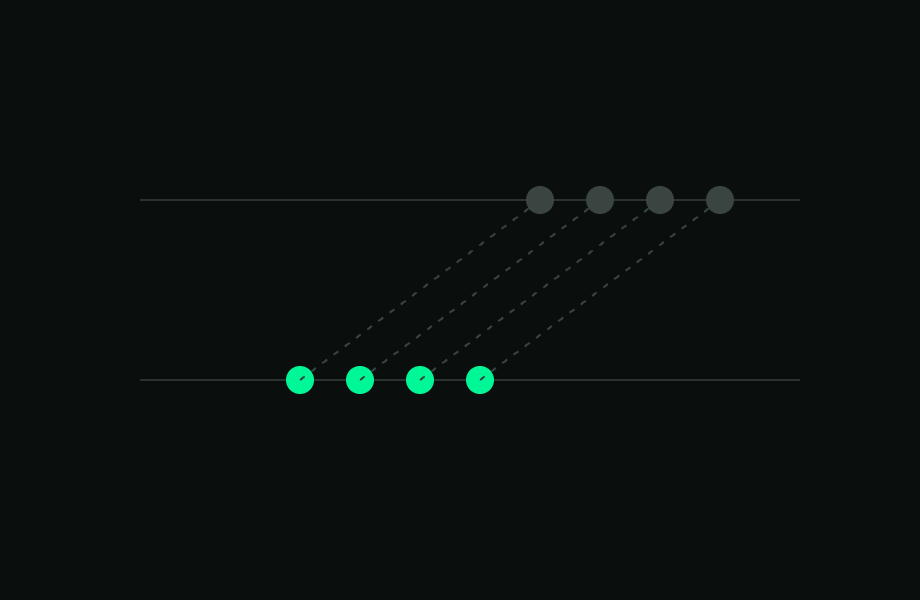
First comes the decision: we raise the price if the new price earns more overall. Because the new price is 10% higher, it pays off as long as the decision rate falls by less than around 9%; at 4.4%, the threshold is therefore about 4.0%. We also fix beforehand from which certainty we decide. For pricing decisions we use a probability of 95%, because a wrong price is expensive and hard to reverse.
The sample size
How many visitors each variant needs follows from the expected rate p and the required precision, the margin of error. The formula: n = (1.96 / margin of error)² × p × (1 − p). At an expected rate of 4.4% and a margin of error of ±1 percentage point, that gives around 1,600 visitors per variant. Budget and runtime follow from the sample size and the cost per visitor.
The result
- Current price: Visitors: 1,500 · Decisions: 66 · Rate: 4.4%
- Price +10%: Visitors: 1,500 · Decisions: 63 · Rate: 4.2%

Step 1: Is the difference significant?
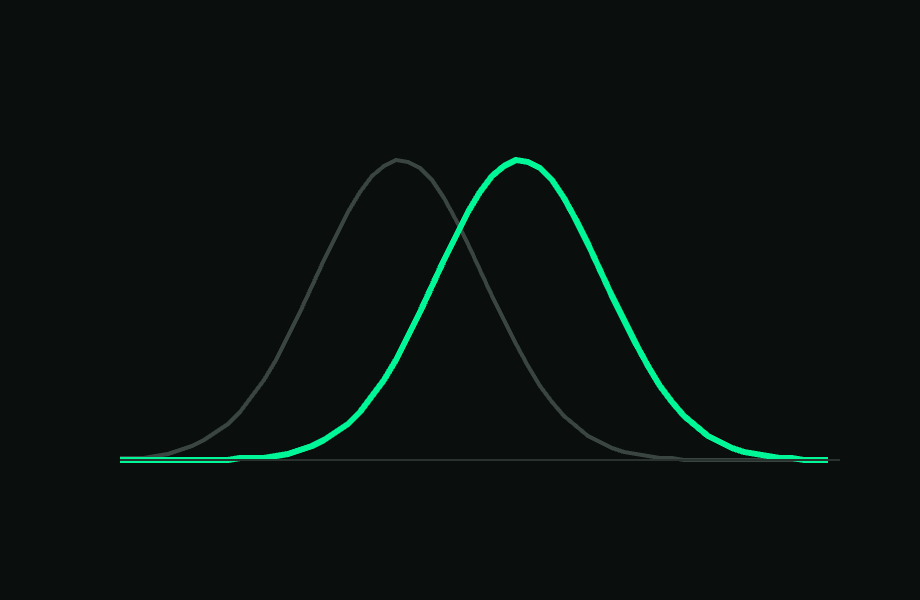
We compare two proportions, the rate of decisions per variant. The appropriate test is the z-test for two proportions (equivalent to the chi-square test for two variants). The difference of 0.2 percentage points is not significant (p ≈ 0.79). The 95% confidence interval for the difference ranges from about −1.3 to +1.7 percentage points.
Important: not significant does not mean “no difference”. It means that the data cannot rule out a difference within this range.
Step 2: How likely is the higher price to be better?
The Bayesian analysis answers the question management is really asking: how likely is it that the new price earns more? To do this, we combine the uncertainty of both rates with the price difference. In the example, the probability that the price +10% brings more revenue per visitor is around 61%.
Step 3: Interpret and decide
61% is well below the threshold of 95% fixed in advance. The result is directional, not confirmed: the higher price costs no recognisable demand, but whether it earns more overall is not yet certain from this sample. The threshold of around 4.0% lies within the interval of the new variant.
- Option A: more sample to narrow the interval, if a lot of revenue depends on the decision.
- Option B: implement the increase with a known residual risk, because no loss of demand is recognisable.
- Option C: add a third variant with a smaller price step to find the limit more precisely.
Common mistakes
- Comparing daily values: days are not independent observations. Visitors and decisions are analysed, not daily averages.
- Stopping at significance: checking daily and stopping at the first significant value finds differences that do not exist too often.
- Looking only at the purchase intent: with price, what counts is what remains per visitor and, with your costs, the contribution margin.
- Reading the result as a forecast: the test measures decisions in a realistic situation, not future market shares.
Frequently asked questions
Why not simply take the variant with the higher rate?
Because rates fluctuate. With 1,500 visitors, the margin of error of a 4.4% rate is about ±1 percentage point. Only the statistical analysis shows whether a difference is larger than this noise.
What happens if the result is inconclusive?
Then we say so openly and show the options: more sample, a decision with known risk or a follow-up test with other prices.
About the author
Daniel Putsche
Founder and CEO of Horizon. Works with product, pricing and insights teams to base decisions on measured purchase behaviour.
Related articles




Which decision do you want to validate?
Bring your decision question, we sketch a possible test design with you. No preparation needed on your side.

You will talk to Daniel Putsche
Founder & CEO, 30 minutes